Väre
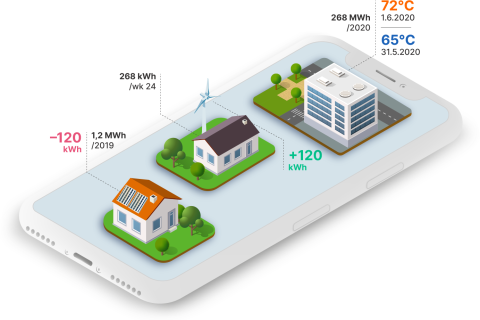
Your personal Energy coach. Survey your energy consumption and take action to reduce your carbon footprint to save environment!

Duty to communicate with product owner and stakeholders, responsibility for user interface and user experience.
Design work was done in collaboration with developers due to several integrations to third party services.
How to create and execute software which is intuitive and easy to use for elder folks and tech-savvy millenials? Translating masses of data into understandable graphs
The process
Household consumption
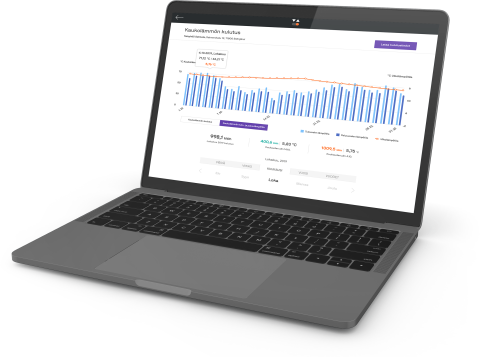
Electricity consumption is presented hourly, daily, weekly, monthly and yearly. Average values for comparison from the last five years are presented in history section.

Integrated market price suggesting usage hours
Useful for pensioners, shiftworkers or persons working from home, electricity contract based on market price can save one’s pennies. Avoid the peak hours and divide your chores to lowest hours.


Warming with district heating
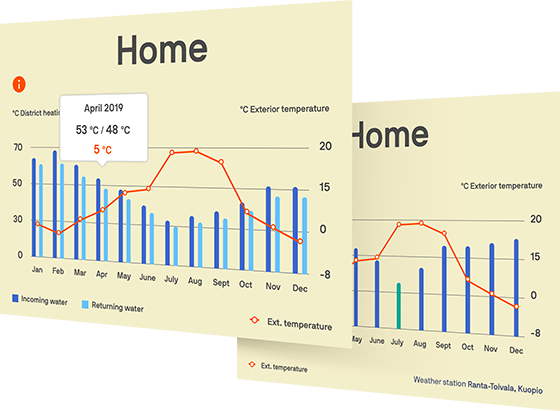
District heating was brought as its own section for detached building residents with district heating installed. Whether it’s consumption or machinery’s sensors surveying water temperature, all can be browsed quickly.

Harnessing solar, wind or water power
Having solar panels or equivalent green electricity production plant in your backyard? Integrating it into Väppi its production and used power is presented an hourly range.

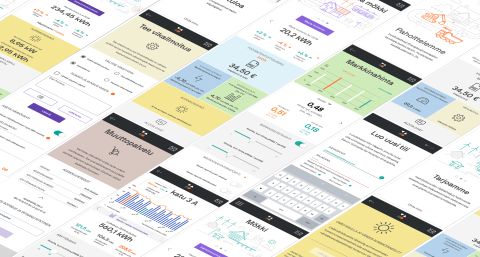
Main layout overviews

Highest rated Finnish energy surveying application in 2019-2020
Results & thoughts
I was working in this project for 2 years, during this time the electricity company went through a fusion which led to a brand update done by an external company. The visuals changed in the middle of the project which brought some challenges into the process. Nevertheless, the end result was succesful.